

BEST SUPER CURRENCY MT4 INDICATOR is very simple and very profitable provided you trade according to the rules. The system is for intraday trading. It is also designed to be traded only on the H1 time frame. It is set up for taking 20-30 pips each trade. You will easily find more than 5 best trading opportunities per day. This system will guide you beyond your dreams. The indicators used in this system are not made by me, but the combination and this system is invented by me. So, the credit for the indicators should go to those who created them.
Identifying the Trading System and Indicators.
Trend Candle. In this system, you can see a different candle. It is not the usual candlestick or HeikenAshi. This Trend Candle helps to identify the trend.
Color MA
Then we use a powerful Moving average signal. Let’s call it “color MA”.
BLUE for BUY
RED for SELL
You will get a Sound alert, when the Color MA changes its color. You can change the Sound if you wish. I use a Long Audio sound for this alert.
White MA
Then we use another MA. Let’s call it the “WHITE MA”. This is our trading direction. So, we never trade against White MA direction.
Price above White MA— > BUY
Price below White MA— >SELL
Yellow DOT.
Then we use a parabolic signal. Please refer to the charts to understand the flipping of these yellow dots.
Yellow Dot Above the current candle —> Sell
Yellow Dot Below the current candle —> Buy
ATR Signal
Next, we use a powerful signal. You can see Pink Dots and BLUE Dots in the chart.
PINK DOT—> SELL
BLUE DOT—> BUY
MACD SIGNAL
Next, we use a MACD Signal. You can see an Up and Down Arrow with a vertical dot line in the chart.
Pivot points
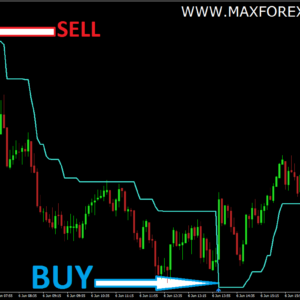
We use pivot points in our system (Horizontal lines S1, S2 …). But, you don’t have to worry about pivot points for trade entries. We use Pivot points to set our Take Profit or TP’s. Normally I use Next Pivot point or 20 pips for my TP.
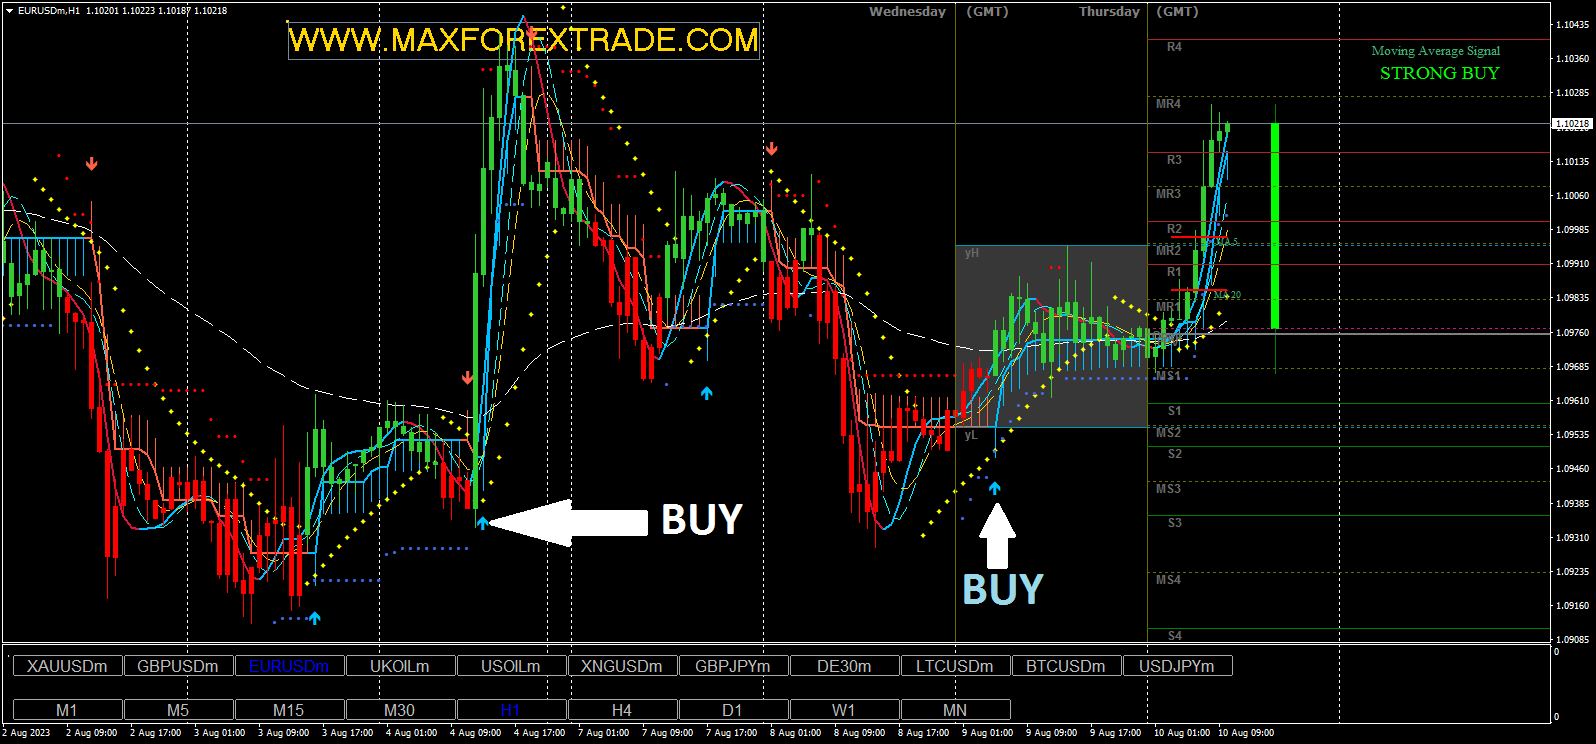
Trade Entry.
We trade only on H1 Time frame.
Always wait until close of the candle for trade entry and exit.
(The remaining time until the expiration of the current candle is indicated next to the current candle.)
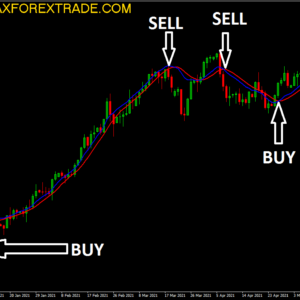
Trade Type 01— > Fresh Candle Trade
Sell Order
1. Color MA changes its color to RED. (Wait for Sound alert/ Wait until close the candle)
2. Trend candle change its color to RED (Wait until the close of the candle).
3. Red candle should close below White MA
4. These 3 should appear above the Red candle
A. MACD Down Arrow
B. Yellow DOT
C. PINK DOT
And the opposite for BUY orders
Important
Always wait until “Color MA”change its color. Then check other confirmations.
After the “Color MA” signal, a “Fresh Candle”should be the First or second Red candle or the previous Red candle.(For a sell )
Also get an idea about the distance between the price and the “White MA”. More closer to the “White MA” is better. You can see a pips counter between the price and “White MA”—> Top Left corner
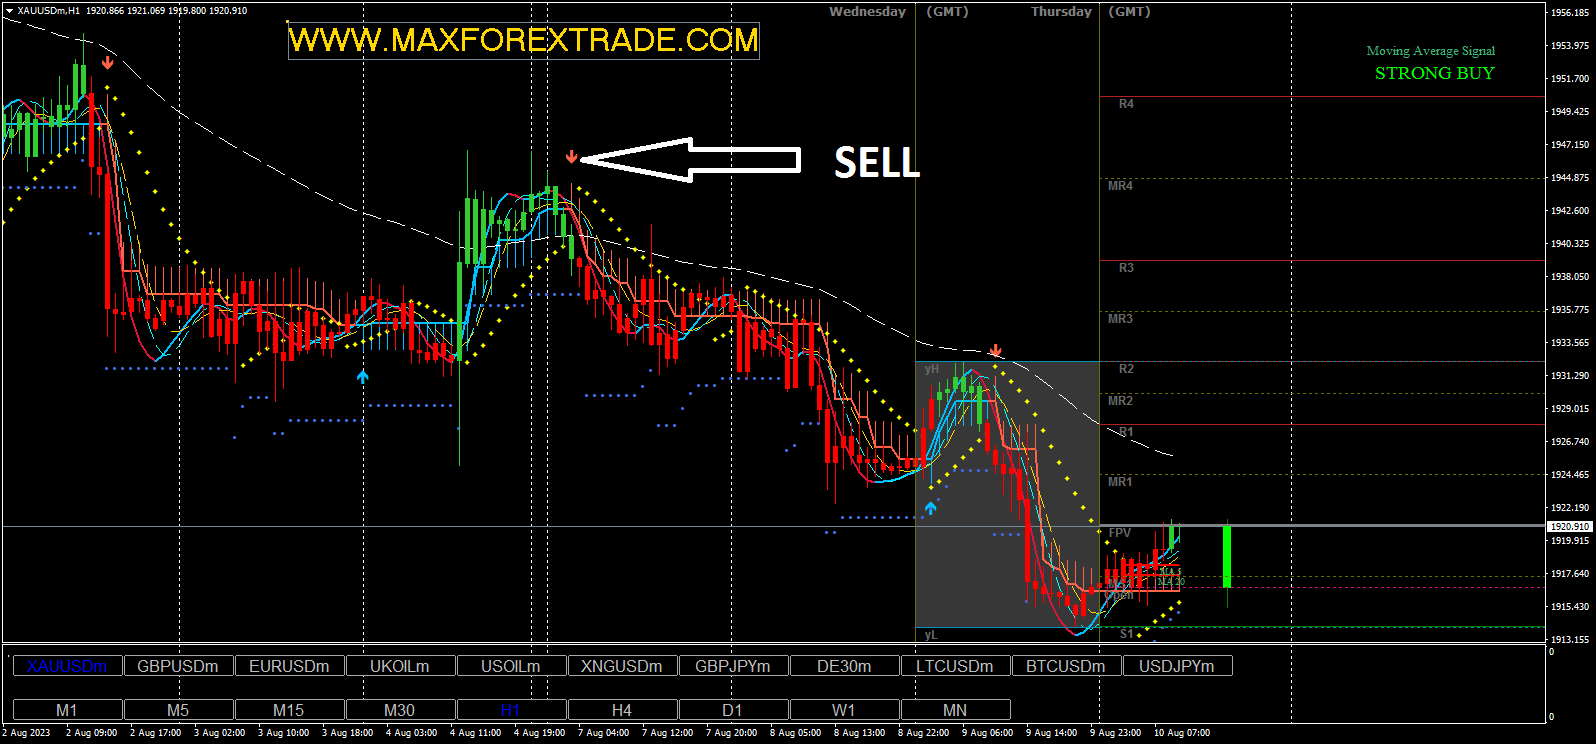
Trade Type 02—– > Gold Trade
Sell Order
1. Color MA changes its color to RED. (Wait for Sound alert/ Wait until close the candle)
2. Trend candle change its color to RED ( Wait until close the candle )
3. Red candle should close below White MA
4. These 2 should appear above the Red candle
A. Yellow DOT
B. PINK DOT
So you do not see MACD down Arrow on the Red candle.
LOOK LEFT —- >MACD down Arrow should be within first 6 (Less is better) previous candles for a valid sell trade.
And the opposite for BUY orders.
See attached Examples
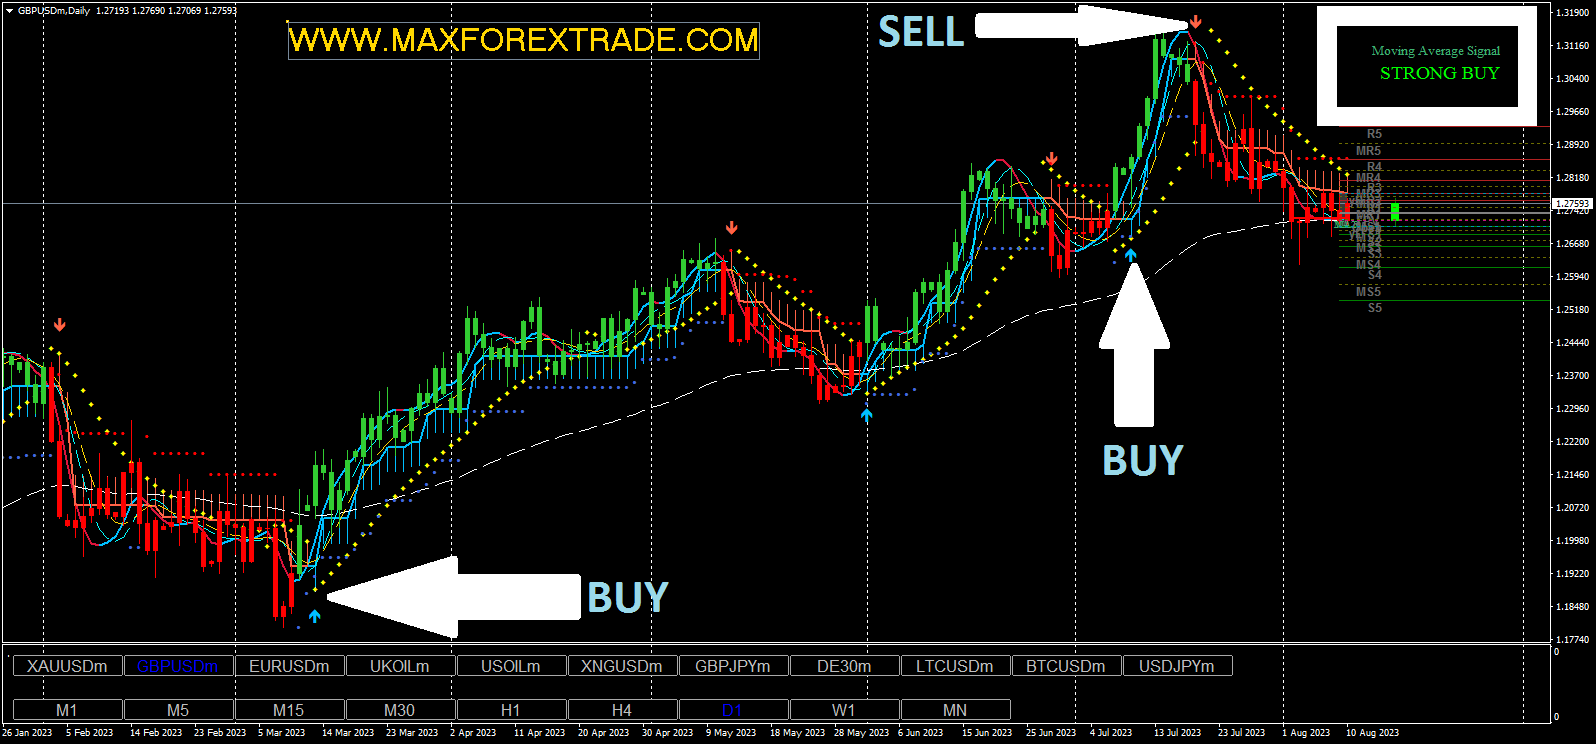
Trade Type 03—– > Second Chance
Sell Trade
This is a re trading on a Trend. Should wait until “color MA”changeit’s color to Blue, then change again in to Red and with MACD flip.
And the opposite for BUY orders.
NOTE :- Trade type 03 is bit risky. So use trade type 03 with your extra knowledge in forex trading. (As a Example I look for MACD Divergence
STOP LOSS
Please Stop loss On the Pink dot in a Sell trade and
Place SL below the BLUE Dot in a Buy Trade.
Or use the Trade Exit method without using a SL (If you can monitor your Trade)
Exit from a loss Trade.
If the price did not hit the TP and is going against our direction, wait until change MA Color + Candle Color.

Reviews
There are no reviews yet.